
What Took PCs 15 Years, AI Did in 3
Prices are collapsing, yet AI spending keeps rising — bankers, scientists, and founders are all saying the same thing.
Opening
Reader, let’s start with a single chart of U.S. newspaper stocks from 2002.
Newspaper earnings forecasts stayed intact all the way through 2007. But their stock prices had already started collapsing back in 2002. The market sold five years before earnings actually fell apart. And in hindsight, it was right.
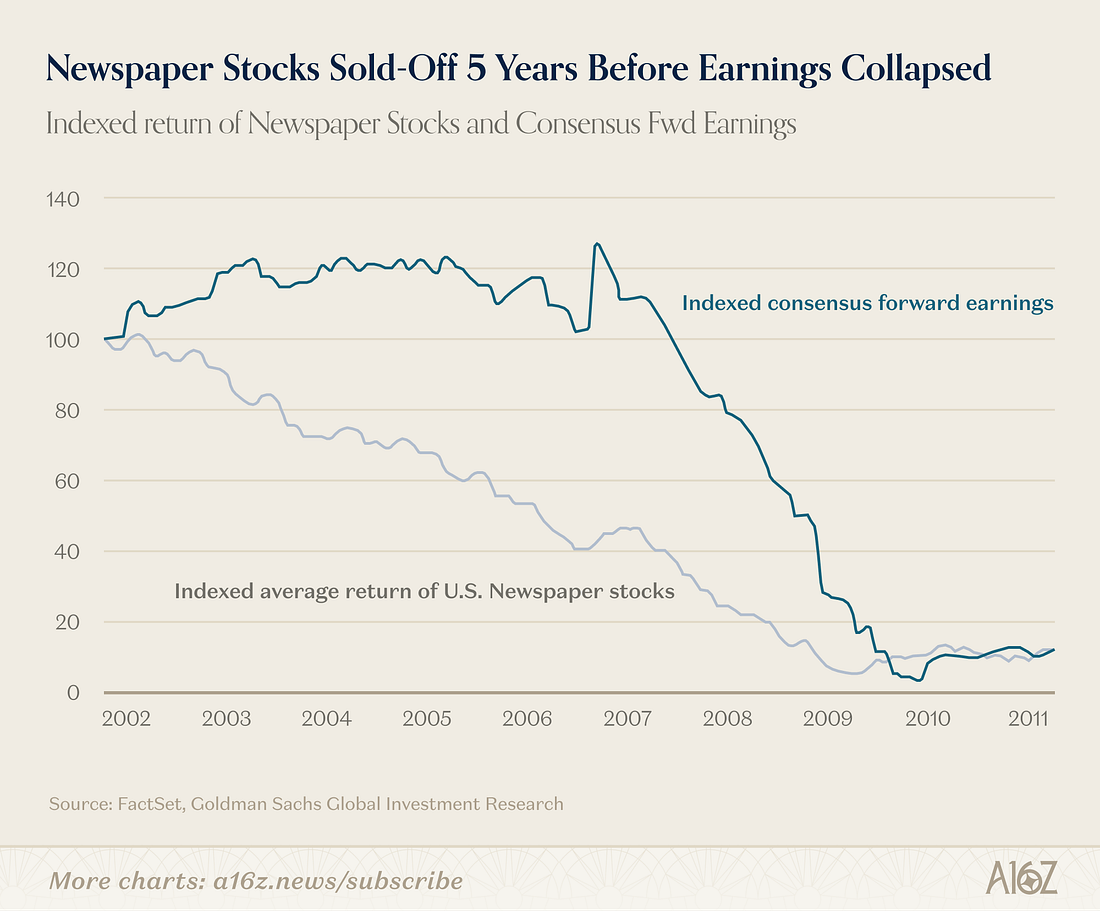 [Chart 1: Newspaper Stocks Sold-Off 5 Years Before Earnings Collapsed]
The same story is circulating in software stocks right now. The logic goes: “Earnings are still fine, but AI will eventually gut SaaS, so we should sell early, just like with newspapers.” And indeed, software companies’ forward 12-month free-cash-flow multiples1 have fallen to their lowest level since 2014.
But is it really the same story? Let me give you the conclusion up front: the data points in the opposite direction from collapse. The price of intelligence is falling five times faster than PC prices ever did — and the cheaper it gets, the more places people are putting AI to work. Today, let’s trace the structure of this paradox.
Why Does the Market Sell Early
Let’s first look at what the software sell-off actually looks like. People call it the “software massacre,” but once you open up the data, it isn’t indiscriminate selling. This phenomenon, often dubbed the “SaaSpocalypse,” gets mentioned constantly by finance YouTubers and fin-influencers, but rarely gets properly analyzed. Most of them are just fitting a narrative onto falling stock prices and generating noise. Let’s look at the chart below.
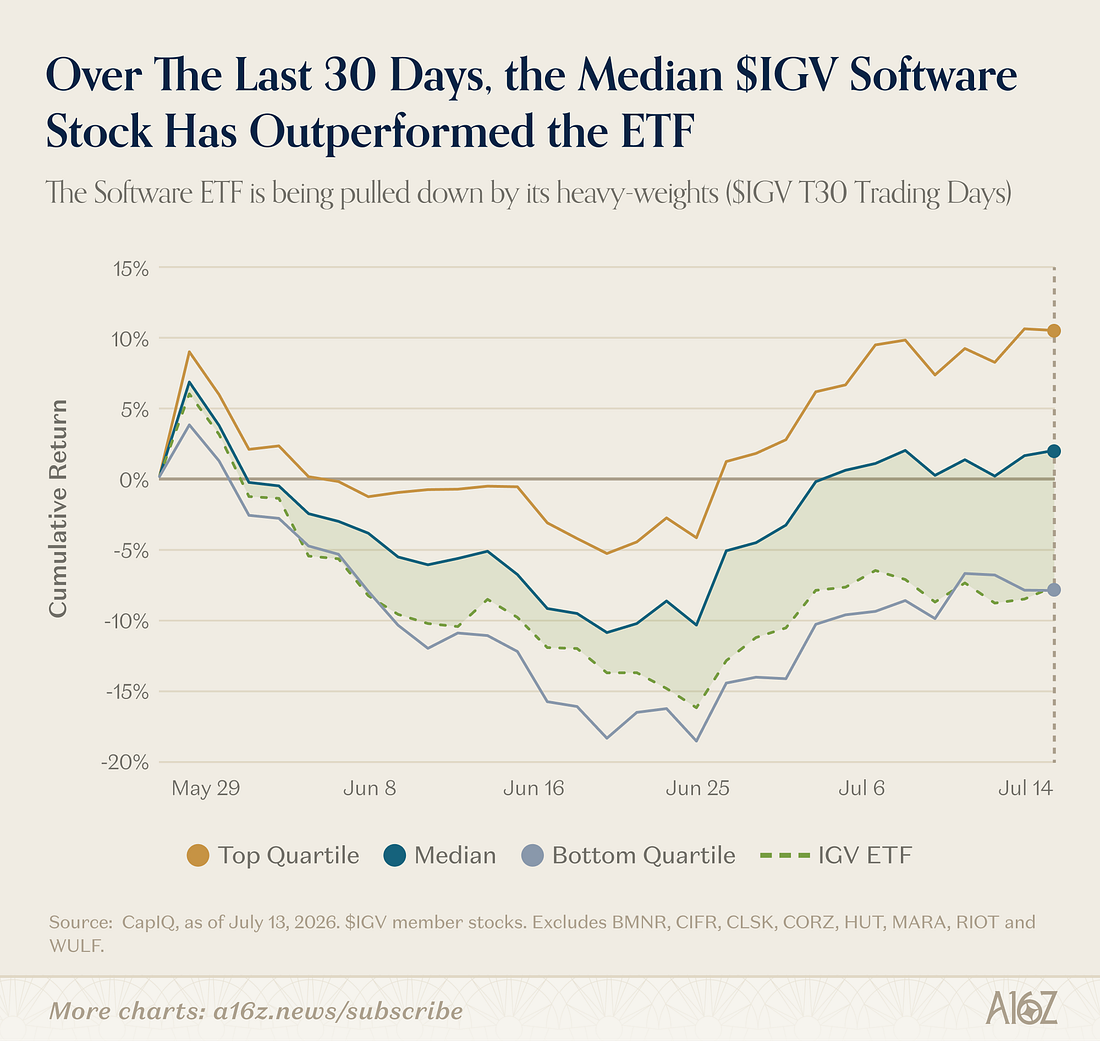 [Chart 2: Software’s Selective Sell-Off, $IGV Returns by Quartile]
If you split the holdings of IGV2, the major U.S. software ETF, into return quartiles, the top and bottom groups moved in tandem right up until the start of the year. Then, starting in January 2026, they diverged — and now there’s roughly a 50-percentage-point gap between the top and bottom quartiles. The top quartile is actually posting positive returns.
What’s interesting is that this gap has almost nothing to do with revenue growth. Some large-cap names with high growth rates are clustered in the bottom quartile. What the market is pricing isn’t today’s growth — it’s whether a company’s moat survives into the AI era. Cybersecurity, observability, and vertical SaaS are being sorted into the “survives” bucket, while horizontal platforms and general-purpose tools are landing in the “at risk” bucket.
In other words, the market’s message isn’t “software is over.” It’s closer to “being software is no longer, by itself, a moat.” And the variable behind this judgment is the star of the next section: the price of intelligence.
The Company Whose Revenue Jumped 85% Said “Subscriptions Are Dead” · Issue 148 · OZ TalkingIn the era when software finishes the work for you, the price tag itself is changingThe Price of Intelligence: Falling Five Times Faster Than PCs Did
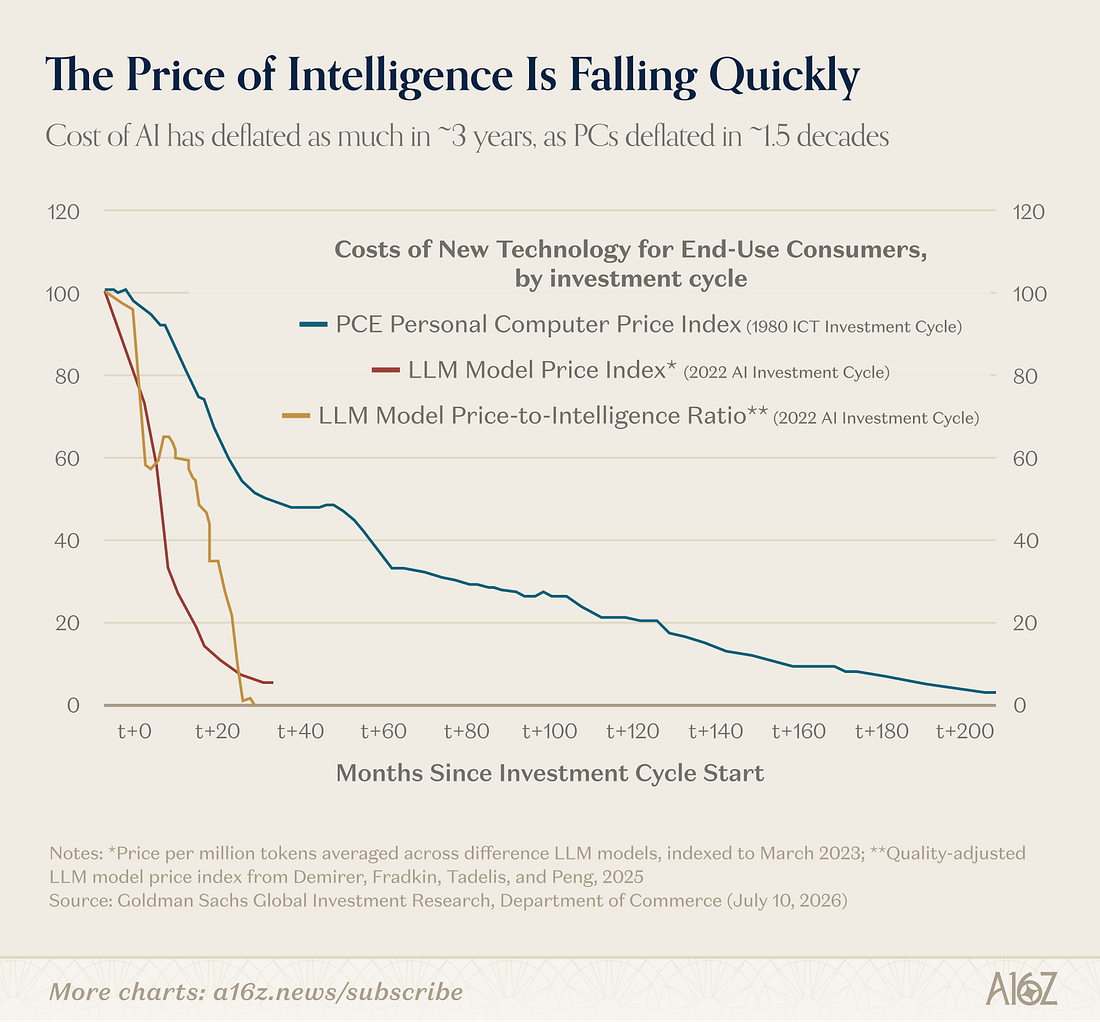 [Chart 3: The Price of Intelligence Is Falling Quickly]
Goldman Sachs overlaid the pace of price decline in the 1980s PC adoption cycle with the AI cycle since 2022. Where the PC price index took more than 15 years to fall to a given level, the LLM price index reached the same magnitude of decline in about 3 years. Factor in performance — an “intelligence per dollar” index — and the decline looks even steeper. The cost of processing 1 million tokens3, roughly equivalent to about 750 pages of A4 text, has shrunk to a small fraction of what it was just 3 years ago.
Two interpretations split off from here. The pessimistic case goes like this: “Frontier models keep getting more expensive to build, but customers have less and less reason to actually use the newest one. If they migrate down to cheaper legacy or open-weight models4, frontier development becomes unsustainable.”
The optimistic case sees it differently: the cheaper it gets, the more use cases open up, and total demand eventually overwhelms the price decline. This is the same pattern the 19th-century economist William Stanley Jevons found in coal — the Jevons Paradox5.
If this feels like déjà vu, you’re right. We covered this same paradox back in Issue 2. That time, it was a story about your individual desk: each task gets faster with AI, but the total volume of work grows too, so you never actually get to leave earlier — a phenomenon UC Berkeley researchers called “work intensification.” Today, we’re widening the same paradox to the lens of the entire market, checking whether what plays out in a single person’s prompt is reproducing itself in nationwide spending data.
We can check which side is right by looking at the data.
The Cheaper It Gets, The More We Spend
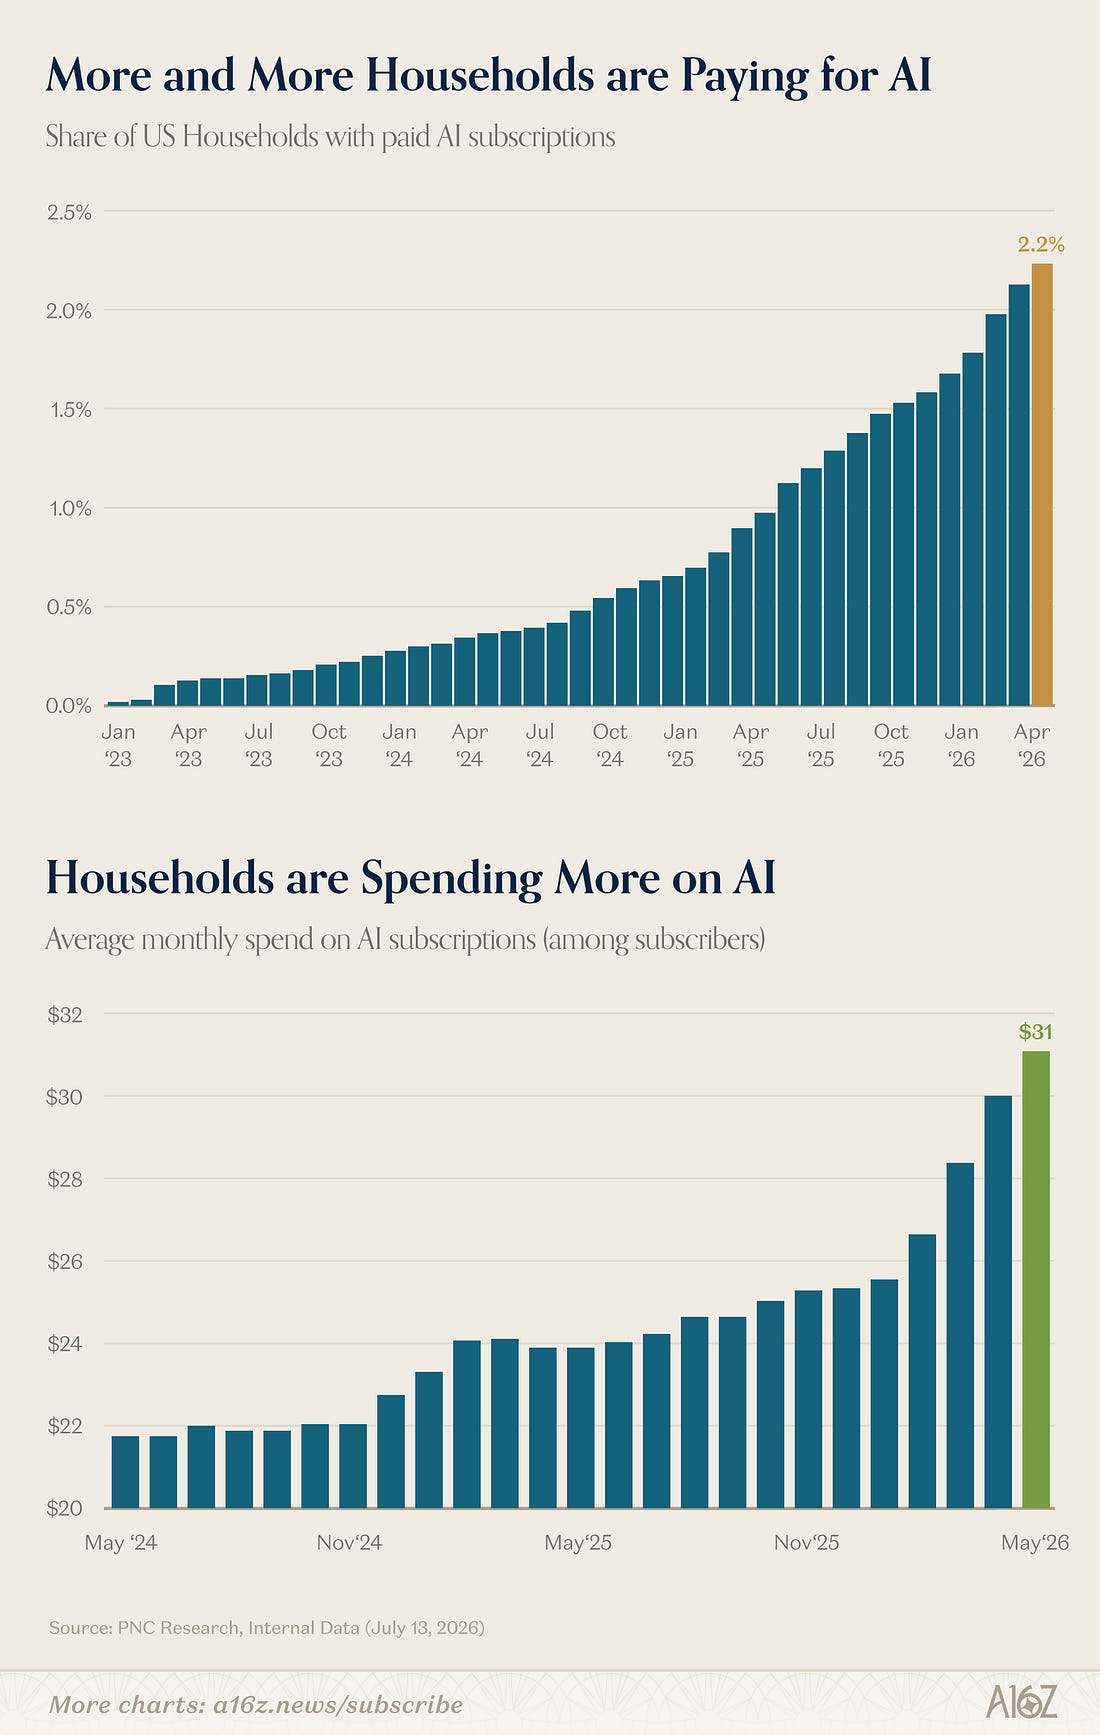 [Chart 4: U.S. Household AI Paid-Subscription Penetration Rate and Average Monthly Spend]
According to PNC Bank’s payment data, the share of U.S. households paying for an AI subscription stood at 2.2% as of April 2026. That’s still a small absolute number, but it’s a curve that has risen without a single dip for three straight years. What’s more striking is the average monthly spend per subscribing household, which is up about 25% since the start of the year, reaching $31. Unit prices are collapsing, yet spending per household is only growing.
The enterprise-side data points the same way. YipitData analyzed usage on OpenRouter, a model-brokering platform, and found that open, low-cost models’ share of token volume tripled from the start of the year to roughly 60%. But over the same period, frontier-model token usage also rose, and per-user token consumption grew far faster than per-user spending. Cheap models didn’t cannibalize expensive ones — the whole pie got bigger, and total spending got pushed upward along with it.
There’s a useful historical data point here. Even decades after PCs went commercial, in 1997, PC ownership among U.S. adults aged 35 to 54 was only about 45%. Today it’s roughly 90% by household, and close to 97% once you include smartphones. Mass adoption of a technology follows two variables — utility and price — slowly, but all the way to the end. A 2.2% penetration rate looks less like a ceiling and more like a starting line.
But let me be honest about one thing here. The very research team that built the quality-adjusted price index in Chart 3 actually reached a more cautious conclusion in that same paper. The Demirer team measured short-run price elasticity6 and found it barely above 1, writing that “the scope for a Jevons Paradox effect appears limited.” In plain terms: even if the price is cut in half, usage only rises by a bit more than double, so total spending stays roughly flat.
So where is the growth in total spending actually coming from? I think this is the real crux of the debate. Existing users spending more (the intensive margin) and new users continuously showing up (the extensive margin) are two different stories. What the research team measured is the former; what a 2.2% household penetration rate shows is the latter. It’s likely that spending growth so far leans much more heavily on new-user inflow than on the Jevons effect itself.
Oswald’s Lens
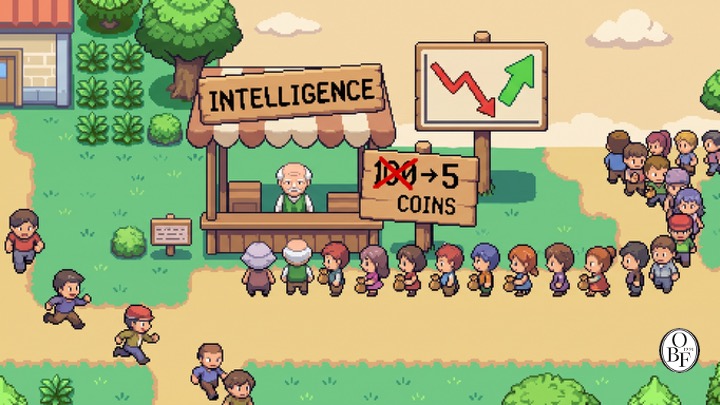 I see these four charts as, at bottom, one story. The market selectively selling software and households ramping up AI spending are two faces of the same event. As the price of intelligence collapses, value is shifting from “being able to build software” to “what you can do exclusively on top of cheap intelligence.”
From my own experience building go-to-market strategy, the most common mistake companies make when a new technology’s unit cost is crashing is to read the price decline as a shrinking market. In reality, every price drop opens up use cases that previously didn’t pencil out, and the surface area of demand itself expands. I saw the same pattern helping SaaS products break into new markets — the customer segment that arrived after the price barrier came down ended up generating most of the revenue.
But the lesson from the newspaper chart still holds. Sometimes the market really is right to sell five years early. Here’s the difference: newspaper demand leaked away to substitutes, while software demand is expanding right now. What’s being destroyed isn’t demand — it’s the ranking of who gets to capture that demand. That’s why I read this moment not as an industry’s end, but as its redistribution.
Closing
If I sum today up in three lines: the price of intelligence is falling five times faster than the PC cycle did. But that decline isn’t killing demand — it’s pushing up both household spending and token consumption together. The market’s software sell-off is a sorting exercise for who keeps a moat on this new board.
So the question to ask right now isn’t “does AI kill software,” but “what exclusive position will my product and my organization stake out on top of cheap intelligence.” That’s the strategy Peter Thiel laid out in Zero to One, and it still works today. I was genuinely floored recently to see a service called same.new in a Y Combinator batch. You feed it a URL, and it replicates that website’s design and rough functionality outright. It’s an idea that sidesteps copyright and a fair bit of ethics — and the fact that Y Combinator, which has always preached entrepreneurship, selected it makes me wonder if we’re watching a real paradigm shift.
same.newHas your AI subscription spending gone up or down compared to a year ago? Tell me in the comments what you’ve started spending more on — and what you’ve cut. I’ll fold it into a future issue.
💬 Tell me how your AI spending has changed in the comments · 📨 If this analysis was useful, share it with a colleague
(Web version only) 📬 If you’d like to receive analysis like this every week, Subscribe I write a weekly newsletter that cross-analyzes tech, economics, and the humanities.
References & Further Reading
Primary sources
- Moses Sternstein, “Charts of the Week: Software’s Selective Sell-Off”, a16z New Media (Random Walk), 2026. 7. 17. ··· The article that forms the backbone of today’s newsletter. All four charts came from here.
- Goldman Sachs Global Investment Research, “Costs of New Technology for End-Use Consumers”, 2026. 7. 10. ··· The core evidence directly comparing the price-decline cycles of PCs and LLMs. It’s paywalled research with no public link, but you can see the chart in the article above.
- PNC Research, Internal Data, 2026. 7. 13. ··· The source of the U.S. household AI paid-subscription penetration rate (2.2%) and average monthly spend ($31) figures. It’s internal bank payment data, so the raw data isn’t public.
- YipitData’s OpenRouter token usage analysis, 2026. ··· Data showing the expanding share of open-weight, low-cost models alongside rising total consumption. Keep in mind the OpenRouter sample may skew toward users of cheaper models.
Counter-evidence (worth reading alongside)
- Mert Demirer, Andrey Fradkin, Nadav Tadelis, Sida Peng, “The Emerging Market for Intelligence: Pricing, Supply, and Demand for LLMs”, NBER Working Paper 34608, 2025. 12. ··· This is the very team that built the quality-adjusted price index in Chart 3. But the paper’s fifth finding is that short-run price elasticity barely clears 1, meaning “the scope for a Jevons Paradox is limited.” It runs head-on into today’s argument, so I’d recommend reading it alongside Section 3 of the main text. The full PDF is also public.
Background
- William Stanley Jevons, The Coal Question, 1865. ··· The original source of the paradox that efficiency gains increase consumption rather than reduce it. The full text is free to read on Econlib.
- U.S. Bureau of Labor Statistics, “Computer Ownership Up Sharply in the 1990s”. ··· The source of the 45% PC ownership figure for U.S. adults aged 35–54 in 1997.
- Digitunity, “The United States Computer Ownership Gap Persists”. ··· The data behind the current roughly 90% U.S. household computer ownership rate.
Past issues worth reading together
- Issue 2: The Structural Reason AI Doesn’t Shrink Your Workload — What 160-Year-Old Coal and 2025 Prompts Have in Common ··· The issue that unpacked today’s Jevons Paradox from the angle of individual work and burnout. Read it alongside the market data, and the full picture comes together.

Footnotes
-
Multiple: A ratio showing how many times a company’s earnings or cash flow its valuation represents. A lower multiple means the market is now paying less for the same dollar of earnings than it used to. ↩
-
IGV: The flagship ETF bundling major U.S. software companies (iShares Expanded Tech-Software Sector ETF). It functions as a thermometer for the software sector. ↩
-
Token: The smallest unit of text an AI model processes — roughly 1-2 Korean characters, or part of an English word. AI usage fees are usually billed by token count. ↩
-
Open-weight model: An AI model whose trained weights are released publicly so anyone can download and run it. It can be operated far more cheaply than a commercial API. ↩
-
Jevons Paradox: The phenomenon where improved efficiency in using a resource seems like it should reduce consumption, but instead lowers the price, opens up new uses, and actually raises total consumption. First observed in 19th-century British coal use. ↩
-
Price elasticity: A number showing how many percent demand rises when price falls by 1%. This value needs to be comfortably above 1 for total spending to rise. Near 1, usage rises in step with the price drop, so total spending stays roughly flat. ↩
Related issues
The Coal Problem: Why AI Never Actually Saves You Time
The paradox where greater efficiency makes you busier is playing out on your own desk right now.
The €9 Parcel Fee Redrawing the World's Trade Map
Shirts, toys, sunglasses: how the EU's new per-item customs fee quietly redraws global shipping routes.
Palantir Grew Revenue 85%—Then Declared SaaS Dead
As software starts finishing the work itself, the price tag underneath it is quietly changing.
Your take shapes the next issue
Reply with your experience or perspective — the best responses feed into future issues.
Sign in to commentAny registered reader can comment — it takes 10 seconds.